Grasping how to interpret a lithium battery's discharge and charging curves is fundamental for assessing performance, maximizing device efficiency, and prolonging operational life. These profiles offer crucial data regarding voltage response, internal impedance, capacity limits, thermal sensitivity, cycle longevity, and the overall state of health.
In this overview, we outline the essential concepts—using straightforward descriptions—to empower you to evaluate lithium battery curves with confidence.
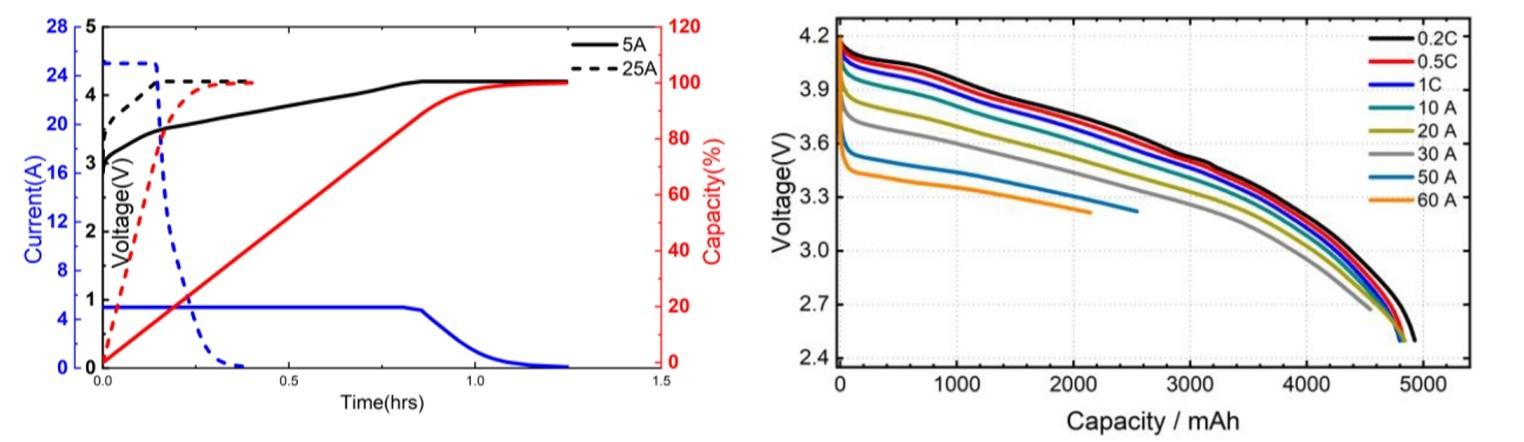
A lithium battery discharge curve depicts the relationship between voltage and either elapsed time or metrics like capacity, State of Charge (SOC), or Depth of Discharge (DOD). Typical axes include:
- Voltage vs. Time
- Voltage vs. Capacity
- Voltage vs. SOC
- Current vs. Time
Why the Discharge Curve Is Important
Discharge profiles disclose:
- Voltage consistency and operational efficiency
- Energy delivery across varying C-rates
- The character of the voltage plateau
- Internal impedance signatures
- Usable energy under diverse load conditions
Such information enables engineers and end-users to anticipate cell behavior in practical scenarios.
The rate of discharge (C-rate) has a pronounced effect on the curve’s contour:
Low C-Rates (C/10, C/5, C/3, C/2)
- The voltage decline is more gradual.
- A stable voltage region endures for a larger portion of the discharge.
- This signals greater accessible capacity and improved energy utilization.
High C-Rates (1C, 2C, 3C, 5C)
- The curve appears steadier but reflects diminished apparent capacity.
- Voltage decay accelerates due to heightened internal resistance and thermal effects.
- This points to constrained performance during heavy loading.
Examining a discharge trace involves evaluating several key indicators of functionality and health.
1. Examine Incline and Plateau Segments
A flatter curve signifies:
- Enhanced voltage regulation
- Robust discharge capability
- Superior energy delivery
The plateau represents the cell's capacity to sustain uniform voltage throughout the primary discharge phase.
2. Assess Discharge Capacity
The integral beneath the curve corresponds to the total extractable energy.
A broader integral = increased usable capacity = extended runtime.
3. Infer Internal Resistance from Curve Dynamics
Internal resistance governs:
- Load-induced voltage depression
- Thermal output
- Discharge productivity
A cell with elevated internal resistance will display:
- A steeper rate of voltage decline
- Diminished power output
- Pronounced sag under heavy demand
Given that internal resistance escalates with age, the curve serves as a practical diagnostic instrument.
4. Gauge Capacity and C-Rate Sensitivity
Contrasting curves obtained at disparate C-rates reveals:
- Lower rates uncover the cell's authentic maximum capacity.
- Higher rates highlight energy forfeited to polarization and impedance.
Such analysis supports cell selection for either high-power tasks or extended-duration applications.
5. Monitor Cycle Life via Curve Progression
A robust cell maintains a steady discharge signature across successive cycles.
Indicators of wear include:
- A lowered plateau voltage
- Shrinking capacity
- Increased gradient steepness
Tracking these shifts enables lifespan forecasting and timely replacement planning.
Numerous variables shape the curve's form and behavior:
1. Battery Chemistry
Each formulation exhibits a distinct profile:
- LiFePO4: Notably flat plateau, consistent output.
- LiCoO2: Elevated energy density, more acute descent.
- LiMn2O4: Moderate voltage steadiness.
2. State of Charge (SOC)
Greater SOC equates to a higher initial voltage. Lower SOC prompts a sharper terminal drop.
3. C-Rate (Discharge Rate)
Elevated rates amplify voltage sag and curtail usable energy.
4. Operating Temperature
Temperature modifies electrolyte mobility:
- Low temp: Increased resistance, more flattened profile.
- High temp: Boosted responsiveness but accelerated deterioration.
5. Battery Age
Aging amplifies internal impedance and curtails capacity, markedly reshaping the curve.
6. Manufacturing Consistency
Material purity, electrode density, and production tolerances dictate discharge traits.
7. Load Characteristics
- Constant current: Foreseeable curve.
- Constant power: Quicker voltage decay.
- Variable load: Irregular, non-linear contour.
8. Internal Impedance
Greater impedance results in more pronounced voltage droop under load.
9. Electrolyte Formulation
Purity and additive content influence ionic transport and voltage consistency.
10. Cell Arrangement
Within a pack, series/parallel wiring schemes modify aggregate discharge dynamics.
11. State of Health (SOH)
Degraded units exhibit truncated plateaus and accelerated voltage decline.
A lithium battery charging curve details the progression of voltage and current throughout the replenishment cycle. It comprises three core stages:
1. Constant Current (CC) Phase
- A fixed current is supplied.
- Voltage climbs progressively.
- The most rapid charging segment.
2. Constant Voltage (CV) Phase
- Voltage is clamped at the upper limit (e.g., 4.2V for standard Li-ion).
- Charge current diminishes exponentially.
- The cell approaches saturation.
3. Trickle or Float Phase
- Minimal sustaining current.
- Preserves maximum charge state.
- Offsets self-discharge losses.
Comprehending this profile ensures secure replenishment and averts perils like overvoltage damage.
1. Charging Efficiency
Contrasting input energy against retained energy reveals the effectiveness of the charge process.
Superior efficiency = reduced thermal waste, extended cycle life.
2. Charge Termination Voltage
This is the threshold designating full charge status.
Correct termination prevents:
- Overcharge conditions
- Lithium plating formation
- Premature capacity fade
Verification confirms the battery operates within established safety margins.
What does a typical lithium battery discharge curve look like?
It initiates with a steady voltage plateau, transitions to a measured decline, and concludes with an abrupt drop as SOC nears depletion.
How does discharge rate affect the curve?
Higher C-rates intensify the curve's steepness and reduce the extractable energy.
What is the voltage plateau?
The operational window where voltage remains relatively unchanged, signifying uniform power provision.
Why does voltage drop rapidly at the end of discharge?
Internal impedance surges as active material is exhausted, causing a swift voltage collapse.
Are lithium-ion and lithium-polymer discharge curves different?
They are largely analogous, though LiPo cells may exhibit minor variations attributable to packaging and construction nuances.
Does temperature affect the curve?
Yes. Reduced temperatures flatten the profile and severely restrict available capacity.
How can discharge curves extend battery life?
Consistent monitoring allows users to circumvent deep depletion and excessive C-rate stress, thereby improving durability.
Next:Svolt Begins Mass Production of 80 kWh PHEV Battery
Previous:Samsung SDI and Mercedes-Benz In Advanced Discussions on EV Battery Supply